Dubai Real Estate Investment Areas 2026: Where Capital Is Actually Flowing | Xperience Realty

Dubai Real Estate Investment Areas 2026: Where Capital Is Actually Flowing

Table of Contents

  • Dubai 2025 closed at AED 917 billion in total real estate transactions across roughly 270,000 deals, with capital flowing in opposite directions across submarkets despite the strong aggregate.

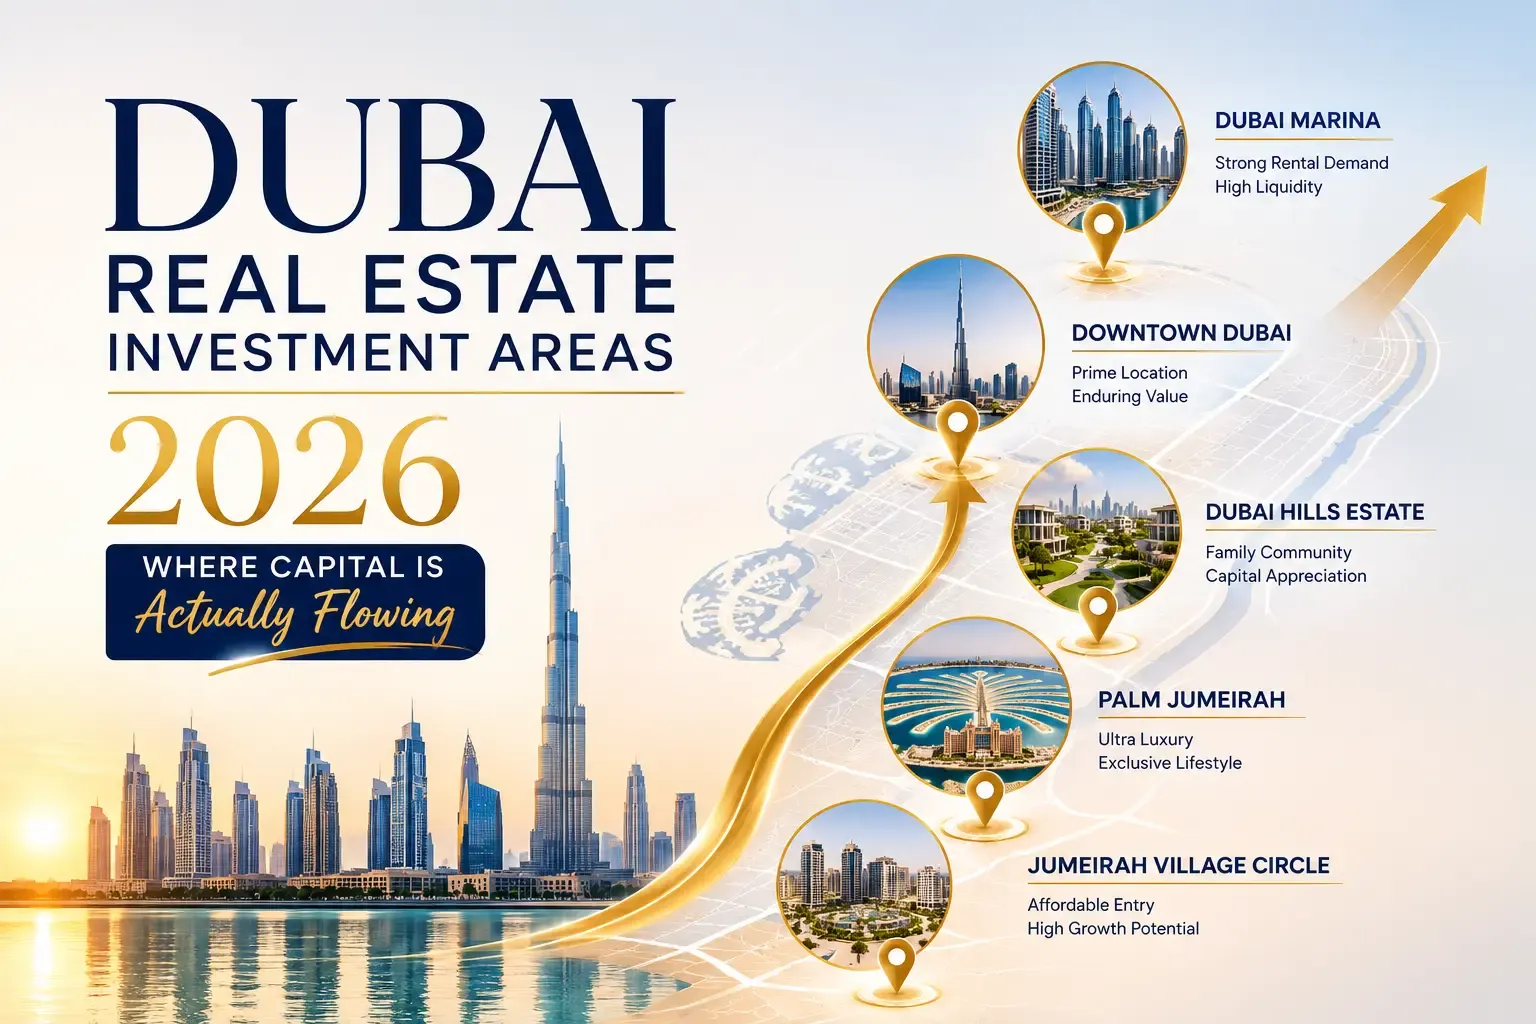
  • Tier 1 villa stock in Dubai Hills Estate, District One MBR City, Tilal Al Ghaf, and Emirates Hills is absorbing the most disciplined capital, with Knight Frank Q3 2025 prime average at AED 3,767 per sq ft.

  • Prime waterfront (Palm Jumeirah, Emaar Beachfront) and branded residences (Bvlgari, One Za'abeel, Dorchester) absorb internationally mobile principal capital from globally diverse buyer pools.

  • Capital is conspicuously not concentrating in undifferentiated mid-market apartment stock in JVC peripheral towers, peripheral Dubai South corridors, and Dubailand Residence Complex.

  • Dubai Hills Estate rental values rose 33.8 percent year on year in 2025 per Knight Frank, the highest rate across Dubai communities, illustrating the divergence between prime and supply-pressured submarkets.

1. "Dubai" is the wrong unit of analysis

The most common mistake in Dubai market commentary is treating the city as a single market with a single capital flow story. It is not, and reading it that way is what produces the worst portfolio outcomes visible at the retail level. In 2025, Dubai recorded around AED 917 billion in total real estate transactions across roughly 270,000 deals, with residential sales reaching AED 544.2 billion across 205,400 transactions per Knight Frank's Q4 2025 review. Inside those headline numbers, capital was flowing in completely different directions across submarkets. The aggregate hides this. The submarket data does not.

My PwC Economics Advisory training drilled in something that applies straight across to Dubai property. Aggregate analysis is a useful starting frame and a destructive decision input. Real estate dynamics operate at the submarket-plus-product-type level. The investor who reads the DLD top-line and deploys based on the citywide story will end up with portfolio outcomes that depend almost entirely on which submarket they actually entered, and most of those outcomes will not match what the headline number predicted.

So the right question is not whether Dubai capital is still flowing in. It is. Knight Frank's Will McKintosh has noted Dubai's transition from a speculative market to one shaped by genuine end-user demand and structural depth. The right question is where, specifically, that capital is landing, and where it is conspicuously not.

2. The capital flow map

Looking at deal flow at the submarket level, three concentrations are visible. The first is tier-1 villa stock in Dubai Hills Estate, District One MBR City, Tilal Al Ghaf, Arabian Ranches 3, and Emirates Hills. Knight Frank's Q3 2025 data showed citywide villa prices up 12% year-on-year and prime communities outperforming sharply. La Mer recorded the steepest individual price increase, with quarterly gains of around 33% and yearly gains over 50%. Across Dubai's ten prime neighbourhoods, prices averaged around AED 3,767 per sq ft, an 8.4% increase on Q3 2024 and roughly 140% above Q1 2019. Only 15,284 villas are scheduled for delivery in 2026, against 99,686 apartments. The 2027 villa pipeline is even tighter at around 5,631 units. The capital flowing into this segment is responding to genuine supply scarcity.

The second concentration is prime waterfront and branded residences. Knight Frank tracked roughly 500 ultra-luxury sales above USD 10 million in 2025, with 143 of those in Q4 alone. Palm Jumeirah saw price stability in Q3 2025 alongside a 19% drop in transaction count, which Knight Frank read as evidence that more homes are being held for the long term rather than flipped. Emaar Beachfront secondary activity has continued to deepen. New launches at Bvlgari Residences, One Za'abeel, and the Dorchester Collection have absorbed institutional capital looking for assets with global passport. The buyer profile in this tier is internationally mobile principal capital, structurally different from the yield-seeking retail buyer that dominates other submarkets.

The third concentration is infrastructure led growth corridors, but with far heavier due diligence than headlines suggest. Dubai Creek Harbour, Dubai South core corridors, MBR City master-plan launches, and Palm Jebel Ali fronds from Nakheel attract capital that is patient and selective. The investors deploying here are typically family offices with 7-15 year horizons rather than buyers expecting near-term yield.

What capital is conspicuously not concentrating in: undifferentiated mid-market apartment stock in JVC's peripheral towers, less distinguished Business Bay clusters, peripheral Dubai South corridors away from the airport adjacent zones, Dubailand Residence Complex, older International City inventory. This is exactly the segment where Knight Frank and Fitch have both flagged near term price pressure.

3. Why Dubai Hills and JVC behave differently

The cleanest illustration of submarket divergence is comparing Dubai Hills Estate with JVC, two communities sitting a short drive apart. To a citywide analyst, both are Dubai residential. They are running on different physics.

Dubai Hills Estate is absorbing capital at premium prices. The villa secondary market is liquid at multiple price points. End-user families upgrading from apartments form a sticky demand layer that does not reverse on quarterly sentiment. Knight Frank reported rental values in Dubai Hills up 33.8% year-on-year, the highest growth rate across Dubai communities. The 2026 prime forecast of around 3% applies cleanly to this submarket. Cushman & Wakefield's Prathyusha Gurrapu has flagged this kind of established prime stock as the segment most likely to outperform through the dispersion phase.

JVC is absorbing the most acute supply pressure in the city. It is also one of Dubai's most active apartment markets, which is exactly why it draws the supply. Knight Frank's pipeline tracking and DLD data both put JVC near the top of locations by transaction count. Knight Frank's villa rental data showed fragmentation across the segment, with premier communities like Tilal Al Ghaf up 13% while secondary villa locations like Al Furjan dipped 2%. The capital still moving into JVC is largely doing so at the yield-trap end of the distribution, drawn to headline gross yields in the 7-9% range without underwriting the structural pressure on those yields as new inventory arrives.

4. Reading the buyer composition

Different submarkets attract structurally different buyer pools, and reading the buyer composition tells you more about a submarket's resilience than any headline price. Tier-1 villa submarkets are dominated by cash buyers, family end-users, and HNW migration. The cash-buyer share of Dubai overall sits in the high seventies to low eighties, but in established prime villa submarkets the share runs higher. The decision logic of these buyers is anchored to residency, schools, and long-horizon allocation, not to short-term yield arithmetic. They do not reverse on quarterly sentiment.

Branded residence and prime waterfront submarkets attract the most globally diverse buyer pool. Internationally mobile principal capital from dozens of jurisdictions, often acquiring through structured family office vehicles. The demand is uncorrelated with any single regional concern, which is part of why this tier absorbed the March 2026 conflict shock with minimal pricing impact. Goldman Sachs reported villa prices up 16% year-on-year through that exact window, even as transaction values for the segment fell sharply because most owners simply refused to list.

Mid market submarkets attract a structurally different pool. Indian and Pakistani retail investors compressing pre-LRS decisions. First time Dubai buyers attracted by accessible price points. Mortgage-financed acquirers, with mortgage transactions reaching AED 179 billion across nearly 51,000 deals in 2025 per DLD. Knight Frank notes mortgage activity has roughly doubled over the past four years, especially in mid market communities. This pool is more sentiment-responsive, more leveraged, and more vulnerable to liquidity events. When sentiment turns, this pool withdraws first. That is what produced the volume-versus-price disconnect through the March conflict period.

5. Off-plan concentration patterns

Off plan dominated 2025 transaction value. Knight Frank's data and Cushman & Wakefield analysis both put off-plan share around 60-65% of volume through the year. That headline figure is not evenly distributed. Capital is concentrating in off-plan from Emaar, Nakheel, Sobha, Aldar, and Meraas, the developers whose balance sheets and delivery records function as effective credit. A 60/40 Emaar payment plan on a Creek Harbour or Dubai Hills Extension launch is being treated, correctly, as a leveraged position on a credible counterparty.

Capital is conspicuously thinner on second-tier and third-tier developer off-plan in peripheral zones, even where the headline payment plans look more attractive. The Q3 2025 Property Monitor data on in-construction resale activity is the clearest evidence of this divergence. Most off-plan acquired in the launch frenzy of 2024-25 was bought on the implicit assumption it could be assigned before handover. The actual secondary market for in-construction units in mid-tier developer projects in peripheral submarkets has not supported that assumption. Buyers are now holding to handover, by necessity rather than choice.

6. The infrastructure effect on flows

Dubai's published economic strategy includes substantial committed infrastructure spend through the second half of the decade, and that spend is producing observable concentration effects on private capital flows because sophisticated buyers are reading the delivery map and positioning accordingly.

The Blue Line metro extension is the most recent example. Confirmed station locations have measurably moved capital into adjacent corridors, with mid-market communities along the route seeing meaningfully stronger price action than communities of similar specification without the metro adjacency. Etihad Rail alignment is producing similar effects in the corridors it touches. The Al Maktoum International Airport expansion, with its committed AED 128 billion phase-two budget targeting 150 million passengers by around 2032 and 260 million eventually, is anchoring capital flows into core Dubai South corridors while leaving peripheral Dubai South stock without the same support.

The 2040 Urban Master Plan corridors are the longer-horizon concentration. Capital with 10-15 year horizons is positioning along these corridors at prices that do not yet reflect eventual infrastructure delivery. This is patient capital, often family office, and it is mostly invisible in monthly transaction data because the deployment is concentrated, selective, and not particularly time-pressured.

7. What the anti-flow tells you

Reading where capital is exiting is as informative as reading where it is concentrating. Bayut's 2025 rental data showed decreases of up to 13% in specific bed-type configurations in certain mid-tier villa communities, with Al Furjan, JVC, and Arabian Ranches 3 all flagged. Q1 2026 Bayut data showed apartment rents in Dubai Marina and Downtown down up to 5% in particular tower-and-configuration combinations. This is not generalised softening. It is concentrated in specific micro-markets where new supply is competing with existing inventory.

The geographic concentration of asking-price reductions is revealing. They cluster in JVC studios and one-bedrooms, peripheral Business Bay towers, Dubailand Residence Complex, older Discovery Gardens stock, and certain peripheral Dubai South towers. They do not cluster in Dubai Hills Estate, Emaar Beachfront, Palm Jumeirah villa stock, or core Dubai Marina. This is what the dispersion cycle looks like in price data. The same Dubai market is simultaneously absorbing capital at premium prices in some submarkets and releasing capital at observable discounts in others. The only way to see this is at the submarket level. The citywide aggregate masks both patterns.

8. Capital has already picked sides

Capital flows in Dubai 2026 are not following the citywide narrative. They are following a submarket-level structural map that sophisticated investors have already built and are deploying against. Buyers who continue to read the market through the citywide lens, asking whether Dubai is up or down or overheating, will keep deploying into the wrong submarkets at the right times and the right submarkets at the wrong times.

The investors reading the submarket map see what is actually happening. Tier-1 villa stock and branded residences are absorbing disciplined capital at premium prices. Infrastructure-led corridors are receiving selective deployment from patient capital. Mid-market and undifferentiated apartment stock is releasing capital at observable discounts. These three patterns are happening simultaneously inside the same city. They will keep diverging through the next two to three years as the supply wave resolves and the dispersion cycle plays out. If you are evaluating Dubai based on the citywide story, you are looking at the wrong data.

About the Series

The Dubai Allocation is a 20-part research release published by Xperience Realty in May 2026, treating Dubai real estate as a capital allocation decision rather than a transactional one. The release functions as a 2026 mid-year house view, written for principals, family offices, and internationally mobile capital evaluating Dubai through the rest of 2026 and beyond. The full research package is available at xrealty.ae

About the Author

Senior Consultant in Private Wealth and Real Estate Advisory at Xperience Realty, Dubai. I work with family offices, HNW principals, and internationally mobile capital on luxury and institutional-grade allocations. Before this, I spent four years across PwC Economics Advisory, Accenture (US residential mortgage modelling through the post-2008 recovery), Unilever, and TATA Steel. MBA from IIM Kozhikode. KHDA-certified Luxury Brand Manager. For a private discussion of how the framework applies to a specific portfolio or mandate, direct enquiries are welcome.

Frequently Asked Questions

Tier 1 villa communities (Dubai Hills Estate, District One, Tilal Al Ghaf, Arabian Ranches 3), prime waterfront (Palm Jumeirah, Emaar Beachfront, Palm Jebel Ali prime fronds), and branded residences (Bvlgari, One Za'abeel, Dorchester) are the segments most likely to outperform in 2026 per Knight Frank and Cushman & Wakefield.

JVC faces concentrated supply pressure in 2026, with Cushman & Wakefield identifying it among five districts holding 45 percent of all under construction stock. Bayut data shows rents in specific JVC configurations softening up to 13 percent. Yield tilted positions in JVC require careful asset selection and stress-tested rental projections.

Knight Frank's Q3 2025 review puts the average across Dubai's ten prime neighbourhoods at AED 3,767 per sq ft, an 8.4 percent increase on Q3 2024 and roughly 140 percent above Q1 2019. Average villa pricing is AED 2,250 per sq ft; average apartment pricing is AED 1,798 per sq ft.

HNW capital is concentrating in three areas: tier 1 villa communities for family residency, prime waterfront and branded residences for trophy and preservation positions, and selective infrastructure-led growth corridors (Dubai Creek Harbour, Palm Jebel Ali, Dubai South core) for long-horizon appreciation.

Dubai South has a strong structural thesis anchored by the AED 128 billion Al Maktoum International Airport Phase 2 expansion, but performance is divergent within the master plan. Core corridors adjacent to airport terminals are absorbing institutional capital. Peripheral corridors face the same supply pressures as other mid-market clusters.

Contact Us