
Arancia at The Yards: Beyond’s First Move Inland
Arancia The Yards by Beyond launches in City of Arabia from AED 1.1M, with a 40/60 plan and Q1 2029 handover. Explore prices and investment potential.
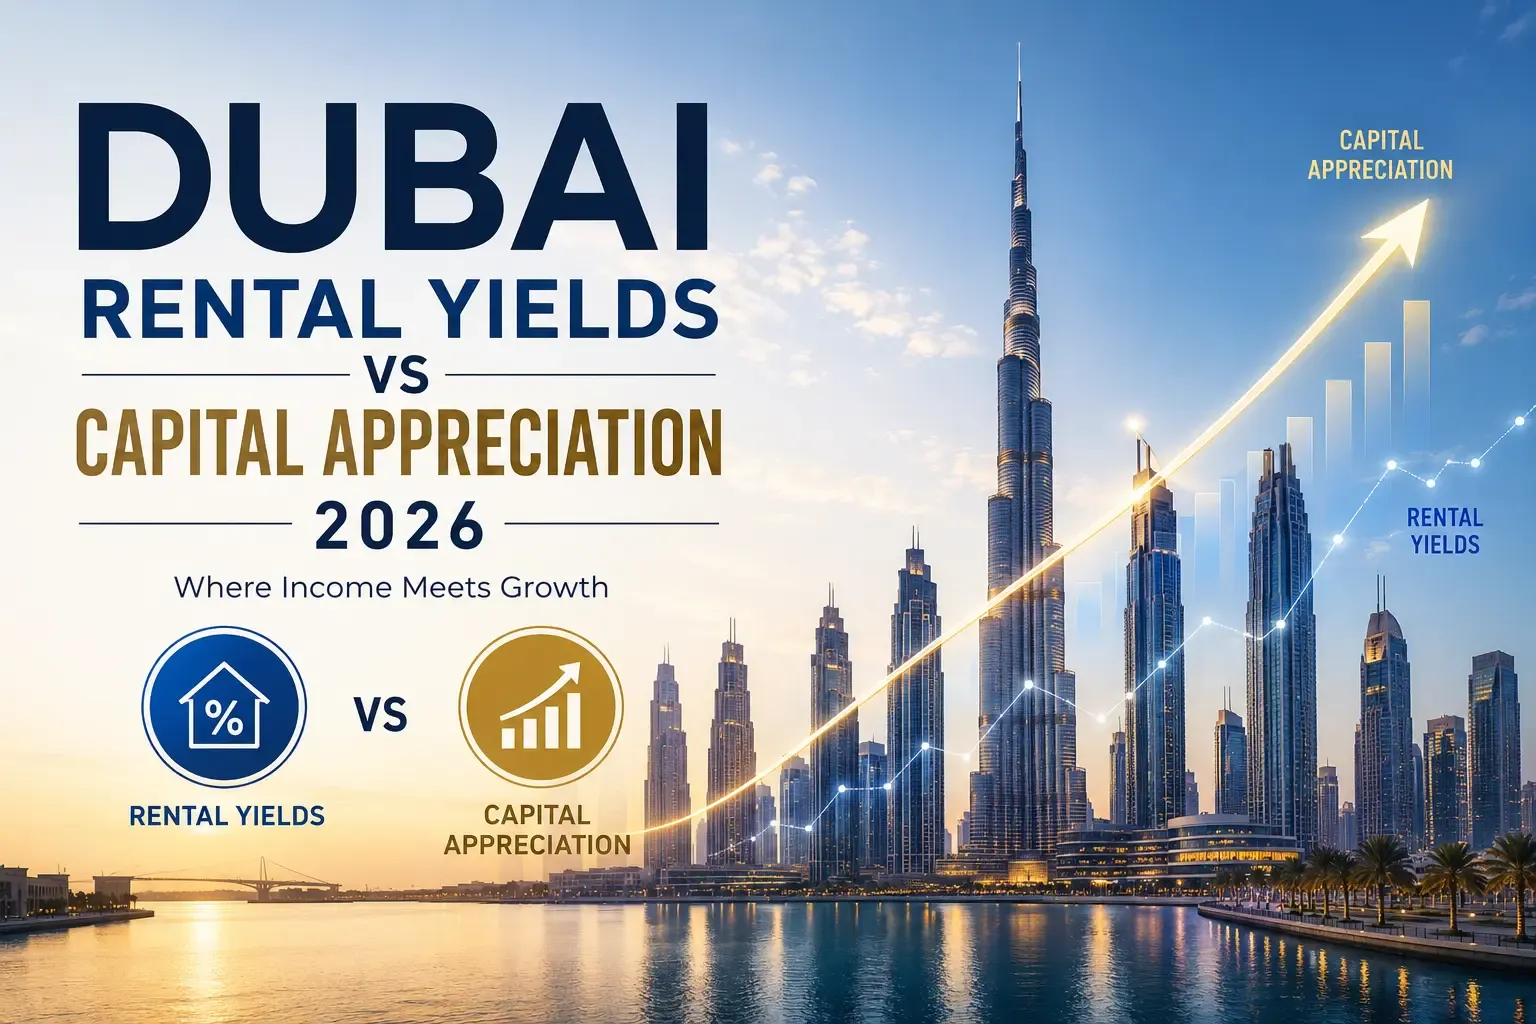
Dubai delivers 2 to 4 times the rental yields of comparable global markets, but yield is a lagging indicator and capital appreciation is a leading indicator for total return.
Total return equals net yield plus capital appreciation plus liquidity component, and the third component is what most retail analysis ignores.
Dubai Hills Estate rental values rose 33.8 percent year-on-year per Knight Frank, the highest rate citywide, illustrating that high-quality submarkets deliver yield growth alongside capital appreciation.
Yield tilted (JVC, Arjan, Al Furjan), hybrid (Business Bay core, Dubai Hills, Dubai Marina core), growth-tilted (Dubai Creek Harbour, Palm Jebel Ali), and scarcity-tilted (Palm Jumeirah villas, Emaar Beachfront, branded residences) require different portfolio sizing.
High gross yield is frequently a warning signal: International City and parts of Dubailand offer 8.5 to 10 percent gross yields precisely because the market has identified structural quality issues.
Sit across from almost any investor considering Dubai and within five minutes you will hear the same pitch back. The yields are incredible. 7%, 8%, sometimes 9% gross. Way better than London or New York. I want passive income. This is the obvious play.
None of this is wrong. Dubai does deliver yields 2-4x what is available in comparable global markets. Passive income is a legitimate objective. The zero-tax regime makes the gross-to-net conversion meaningfully better than almost anywhere else. At the headline level, the math looks obvious.
But headline math is where most retail investors stop, and stopping there produces outcomes that often underperform what the same capital could have achieved with a more sophisticated frame. Real estate is not a yield trade or an appreciation trade. It is a capital allocation decision, and the right lens is not which metric you chase but what role the asset plays in your capital structure over time. The retail framing treats yield and appreciation as competing metrics. The institutional framing treats them as components of a total return equation, weighted according to what the capital actually needs to do.
Most Dubai market commentary frames the choice as a simple trade off: high yield means low growth, high growth means low yield. This is intuitively satisfying and substantively incomplete. Real estate does not allocate returns along a zero-sum axis between yield and appreciation. Both are outputs of underlying fundamentals. What varies is the shape of total return: how much comes from cash flow, how much from capital gain, over what timeline.
The more useful framing is to start from capital intention. Cash flow capital is capital whose primary job is income generation, funds lifestyle, covers leverage costs, meets distribution commitments. It prefers stable rental demand, established communities, lower volatility. Growth capital is capital whose primary job is accumulation. The investor does not need current income; they need the capital base to compound. It prefers infrastructure-led appreciation. Base layer capital is capital whose primary job is preservation with optionality, the category most HNW clients are actually operating in. It prioritises liquidity, tier 1 counterparty quality, assets that hold value across cycles.
The same investor with the same AED 10m allocation could construct three very different portfolios depending on which capital intention is dominant, and all three could be correct for their intended purpose. Yield and growth are not market characteristics. They are capital intentions. The mistake most investors make is optimising for the metric that sounds attractive rather than the one their capital actually needs.
Yield is a lagging indicator. It reflects rents being paid today, against purchase prices set at the last transaction. Yield tells you where the market is. Capital appreciation potential is a leading indicator. It reflects future infrastructure delivery, expected population absorption, supply pipeline timing. Appreciation tells you where the market is going. These are fundamentally different temporal signals.
Knight Frank's Q3 2025 review showed prime Dubai prices up 8.4% year on year and 140% since Q1 2019, with specific submarkets like La Mer up 33.8% quarter-on quarter. Yield in those submarkets did not jump 33.8%. An investor reading 2025 yield data and concluding "this is a stable yield market" would have missed the appreciation entirely.
The inverse is also true. International City and similar communities run gross yields among the highest in the city. That yield exists not because demand is strong; it exists because purchase prices are low because the submarket has structural issues with build quality, service charge management, and secondary market liquidity. The high yield is a real number. It is also a warning signal.
Dubai's 2026 position is a transition between the growth and stabilisation phases. Bayut's 2025 data showed rental decreases of up to 13% in specific bed type configurations in mid-tier villa communities like Al Furjan, JVC, and Arabian Ranches 3. Q1 2026 Bayut data showed apartment rents in Dubai Marina and Downtown down up to 5% in particular configurations. This is yield stabilisation happening in real time.
The supply wave is concentrating in specific submarkets. JVC absorbing a meaningful share of the apartment pipeline. Dubai South peripheral corridors, Business Bay's less differentiated clusters, apartment-heavy MBR City face direct yield pressure through 2026-27. Rental yield compression of 100-200 basis points in the most exposed clusters is a reasonable working expectation. A 7.5% gross yield in JVC today, after subtracting 1.5-2% for service charges, vacancy, and management, is a 5.5-6% net yield. If rental pressure compresses by 100 bps, the net yield drops to 4.5-5%. Still respectable, but not the 7.5% the brochure showed. Sophisticated capital underwrites yield on the basis of where it will be at stabilisation, not where it is today.
High gross yield is frequently a warning signal. Gross yield equals annual rent divided by purchase price. For gross yield to be high, either the numerator is unusually elevated or the denominator unusually compressed. Both conditions carry information.
Elevated rent relative to price often signals current demand is strong but structural demand is weak. Tenants pay premium rents because supply-demand is tight today, but purchase prices have not caught up because the secondary market is thin. International City and Discovery Gardens currently sit in this zone with 8.5-10% gross yields. Compressed price relative to rent signals the market has identified issues with the asset class, build quality, service charge management, location disadvantages, that depress capital values. The yield looks attractive because the market has already priced the underlying issues.
Communities with high yield and weak appreciation are the yield trap zones. International City, parts of Dubailand, some pockets of Dubai Sports City. Compare to Dubai Hills Estate, where Knight Frank reported rental values up 33.8% year-on-year, the highest growth rate across Dubai communities, alongside strong villa price appreciation. The yield looks mediocre against JVC's 7.5%. The total return profile is structurally superior because the appreciation component is doing meaningful work and the capital base is compounding. High yield is not a free lunch. It is compensation for a risk the market has already identified.
The single most important concept for serious Dubai investors is total return. It has three components retail commentary routinely treats as two. Rental yield (cash flow) net of service charges, vacancy, and management. Capital appreciation. And liquidity, the optionality component.
Liquidity is the component retail analysis consistently ignores, and it is the one my mortgage modelling training at Accenture taught me to weight heaviest. Liquidity is the ability to exit, reposition, or redeploy capital at a fair price when circumstances change. A high-yield asset with poor liquidity is a trap. A lower-yield asset with strong liquidity may deliver the same or better total return because the investor can reposition as the cycle evolves.
Liquidity in Dubai is not uniform. Palm Jumeirah prime villa stock transacts at institutional grade liquidity. Dubai Hills Estate villa product is similar. Emaar Beachfront secondary is developing visible depth. Studio product in certain JVC towers faces secondary market thinness because the primary market competes directly with secondary sellers at similar prices. The correct equation: Total Return = Net Yield + Capital Appreciation + Liquidity Discount. The liquidity discount is the haircut for unclean exit, zero to minimal for tier-1, 200-400 basis points for tier-3 with structural issues, enough to completely erase what looks like a yield advantage on the headline. Calculated this way, the apparent yield advantage of International City over Dubai Hills Estate collapses.
Yield tilted (cash flow priority): JVC, Arjan, Al Furjan, JLT, parts of Dubai Silicon Oasis. 6.5-8% gross; 4.5-6% net; supply pressure through 2026-27 likely compresses yields 100-200bps in JVC and Arjan.
Hybrid (base-layer, total return): Business Bay core, Dubai Hills Estate, Dubai Marina core, Tilal Al Ghaf, Arabian Ranches 3. 5-7% gross; 4-5.5% net; strong appreciation; deep secondary liquidity.
Growth tilted (appreciation priority): Dubai Creek Harbour, Palm Jebel Ali prime fronds, MBR City District One, Dubai South core corridors. 4-5.5% gross; infrastructure-driven upside; 7-15 year horizons.
Scarcity tilted (preservation + optionality): Palm Jumeirah villa clusters, Emaar Beachfront, Bvlgari, One Za'abeel, Dorchester. 5-6.5% gross; institutional-grade liquidity; global buyer depth; capital preservation premium.
Clients routinely ask whether they should go yield-heavy or growth heavy. The correct answer for most HNW capital is neither. A typical AED 20m base layer allocation: roughly 40-50% into hybrid communities (Business Bay core, Dubai Hills, Arabian Ranches 3, Dubai Marina core), the backbone, balanced total return, good liquidity. Roughly 20-30% into yield-tilted (JVC, JLT, Arjan, or DSO selectively) for cash flow support. Roughly 15-25% into scarcity/growth-tilted (Emaar Beachfront, Palm Jumeirah, District One villas) for appreciation and optionality.
What is consistent across sophisticated allocations is that the portfolio is constructed intentionally rather than by asset-level optimisation. The individual yield or appreciation number on any specific asset matters less than the total portfolio's ability to deliver the outcome the capital is actually seeking. Retail capital almost never applies this frame. It picks the community with the highest yield, buys five apartments there, and wonders why the portfolio underperforms over a decade.
Yield pays you today. Appreciation pays you tomorrow. Liquidity lets you act on either when it matters. Total return is the weighted combination, adjusted for the risk profile of each component. If you are choosing between yield and growth, you are still thinking at the asset level. The better question is not which metric wins, but how your capital should be structured across both, against what your capital actually needs to do.
In a beta driven market like 2022-2024, asset level optimisation was forgiving. You could pick the wrong metric and still come out ahead because everything was rising. In a dispersion cycle like 2026, asset level optimisation is punitive. The gap between a well constructed portfolio and a yield chaser portfolio is now large enough to define wealth outcomes over a decade. The framework matters more than the individual trades. The work is alignment. Capital intention matched to asset tier. Tier matched to cycle phase. Portfolio constructed to deliver the outcome the capital is actually seeking.
The Dubai Allocation is a 20 part research release published by Xperience Realty in May 2026, treating Dubai real estate as a capital allocation decision rather than a transactional one. The release functions as a 2026 mid-year house view, written for principals, family offices, and internationally mobile capital evaluating Dubai through the rest of 2026 and beyond. The full research package is available at xperiencerealty.com.
Senior Consultant in Private Wealth and Real Estate Advisory at Xperience Realty, Dubai. I work with family offices, HNW principals, and internationally mobile capital on luxury and institutional-grade allocations. Before this, I spent four years across PwC Economics Advisory, Accenture (US residential mortgage modelling through the post-2008 recovery), Unilever, and TATA Steel. MBA from IIM Kozhikode. KHDA-certified Luxury Brand Manager. For a private discussion of how the framework applies to a specific portfolio or mandate, direct enquiries are welcome.
Headline gross yields are highest in International City (8 to 10 percent), parts of Dubailand, Dubai Sports City, JVC (7 to 9 percent), and Arjan (7 to 8.5 percent). However, after service charges, vacancy, and management costs, net yields compress, and high gross yields often reflect structural issues rather than genuine value.
It depends on capital intention. Cash flow capital prioritises net yield. Growth capital prioritises capital appreciation. Base layer preservation capital prioritises liquidity and total return stability. Most HNW capital should weight all three through portfolio construction rather than optimise for any single metric.
Dubai delivers an average gross rental yield of approximately 6.76 percent across the residential market in 2025, with apartments averaging 7.12 percent and villas at 4.92 percent. These yields significantly outperform London (3.5 percent) and New York (3.9 percent).
Knight Frank's Q3 2025 data showed La Mer with the steepest individual price appreciation at 33.8 percent quarter on quarter and 54.7 percent year on year. Across Dubai's ten prime neighbourhoods, prices rose 8.4 percent year on year and 140 percent since Q1 2019.
The yield trap describes communities where high gross rental yields exist precisely because purchase prices are compressed due to structural issues (build quality, service charge management, location disadvantages, thin secondary markets). The high yield looks attractive but the total return is typically inferior to lower yield, higher quality positions.
Arancia The Yards by Beyond launches in City of Arabia from AED 1.1M, with a 40/60 plan and Q1 2029 handover. Explore prices and investment potential.
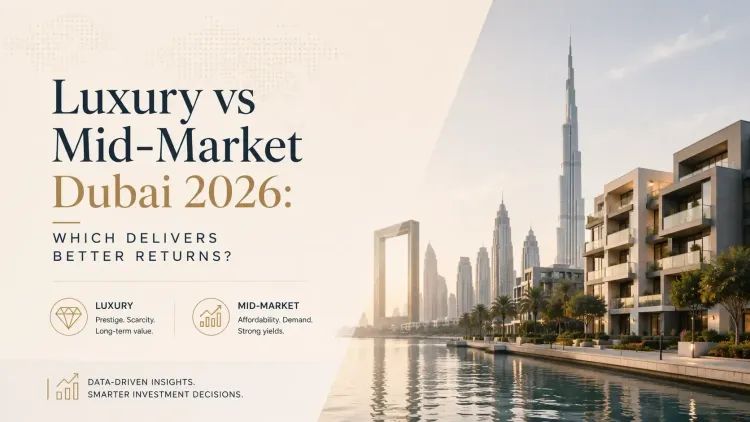
Dubai property investment 2026: luxury vs mid market analysis covering rental yields, capital appreciation, villa supply, and risk-adjusted returns for HNW investors.
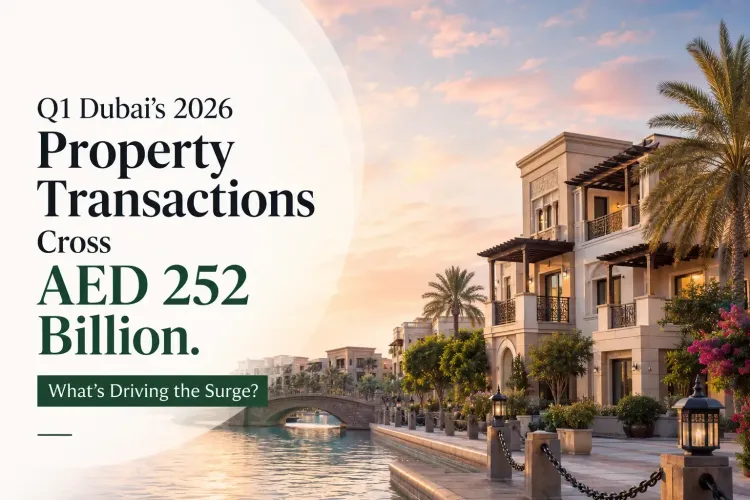
Dubai’s property market continues its upward trajectory, crossing AED 252 billion in Q1 2026 transactions. Explore the latest market insights and opportunities with Xperience Realty.